Using System Stored Procedures to Monitor SQL Server
Dan Sales#Hosting, #Hosting Insights, #Tutorials

We look at how to use the sp_who2 and sp_monitor system stored processes to find valuable data about your SQL Server instance.
Activity Monitor is a great tool, but it can use a sizable amount of system resources when run on the same server as the SQL Server database engine. This is because Activity Monitor is gathering a large amount of data about what’s going on in the SQL Server instance and displaying it to the user in a meaningful graphical manner. Most of the time, this is not an issue, but when the database engine that is being monitored is using all the system resources allotted or all the resources available on the server, Activity Monitor can time out and stop displaying real time data.
When I run into this kind of issue and cannot use Activity Monitor, I fall back on SQL Server’s System Stored Procedures. There are a large number of system stored procedures in 28 different categories that can provide a DBA or designer a great deal of data about what’s happening within SQL Server. The two system stored procedures I will review here are part of the Database Engine Stored Procedures, which are used for general maintenance of the SQL Server database engine.
sp_who2
The first system stored procedure I go to when Activity Monitor is not working for me is sp_who2. This system stored procedure is a variation on the sp_who system stored procedure, and it provides a little more data related to the resources being used in the SQL Server instance. To run the sp_who2 system stored procedure, use the following TSQL statement:
USE master;
GO
EXEC sp_who2;
GO
The sp_who2 procedure returns a result set with the following information:
|
Column Name |
Description |
|
SPID |
SQL Server Session ID |
|
Status |
Process status. The possible values are:
|
|
Login |
Login name associated with the particular session. |
|
HostName |
Host or computer name the login is connecting from. |
|
BlkBy |
If a process is being blocked by another process, the session ID for the blocking process will be returned here. |
|
DBName |
Database used by the session. |
|
Command |
Database Engine command (Transact-SQL statement, internal Database Engine process, and so on) executing for the process. |
|
CPUTime |
CPU time used by session. |
|
DiskIO |
Disk IO used by session. |
|
LastBatch |
The last time a batch request was run by the session. |
|
ProgramName |
The application connecting to SQL Server. |
|
SPID |
SQL Server Session ID. |
|
REQUESTID |
ID for requests running in a specific session. |
From this list of output columns, we can see that the data provided by this system stored procedures is similar to the Processes pane in Activity Monitor and can be used in the same way. The difference is that the results from sp_who2 are only updated when you execute the procedure.
The sp_who2 system stored procedures also allow for parameters to be passed to it. If I wanted sp_who2 to only return results for active SQL Server Session IDs, I can use the ‘active’ parameter. The TSQL statement for this is:
USE master;
GO
EXEC sp_who2 'active';
GO
If I wanted to only display results for a single SQL Server Session ID, then I could use the SPID parameter. The TSQL statement for this is:
USE master;
GO
EXEC sp_who2 51;  --Where 51 specifies the session_id;
GO
Sadly, there is no sp_who2 parameter for returning results for a given user login. To do this, we need to use the sp_who system stored procedure. To get results for a single user login with sp_who, the TSQL statement is:
USE master;
GO
EXEC sp_who 'LOGIN NAME';
GO
sp_monitor
The second system stored procedure I find helpful when I’m not able to use Activity Monitor is sp_monitor. To understand why sp_monitor can be helpful, we must first understand that SQL Server tracks, through a series of functions, the work it has done. Executing the sp_monitor system stored procedure displays the current values returned by these functions and shows how much they have changed since the last time the procedure was run. Knowing how much work the SQL Server instance is doing can give a better understanding of the load being placed on the instance over a set period of time.
To run the sp_monitor system stored procedure, use the following TSQL statement:
USE master;
GO
EXEC  sp_monitor;
GO
The sp_monitor procedure returns a result set with the following information:
|
Column Name |
Description |
|
last_run |
Time sp_monitor was last run. |
|
current_run |
Time sp_monitor is being run. |
|
seconds |
Number of elapsed seconds since sp_monitor was run. |
|
cpu_busy |
Number of seconds that the server computer's CPU has been doing SQL Server work. |
|
io_busy |
Number of seconds that SQL Server has spent doing input and output operations. |
|
idle |
Number of seconds that SQL Server has been idle. |
|
packets_received |
Number of input packets read by SQL Server. |
|
packets_sent |
Number of output packets written by SQL Server. |
|
packet_errors |
Number of errors encountered by SQL Server while reading and writing packets. |
|
total_read |
Number of reads by SQL Server. |
|
total_write |
Number of writes by SQL Server. |
|
total_errors |
Number of errors encountered by SQL Server while reading and writing. |
|
connections |
Number of logins or attempted logins to SQL Server. |
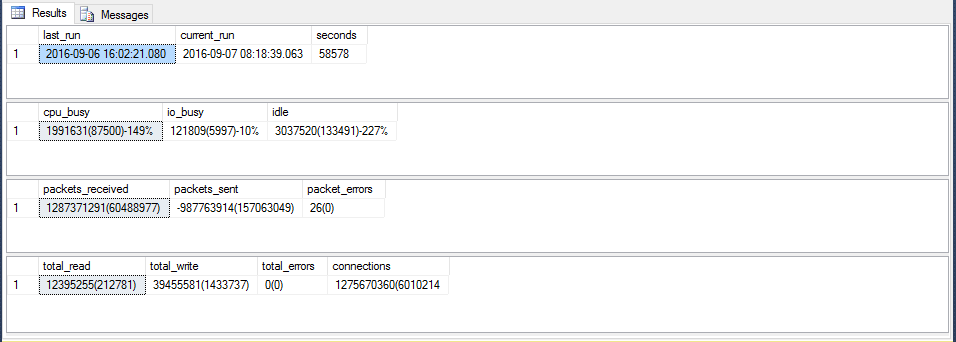
The output of sp_monitor is not returned is a standard single results set, but in 4 results sets. Normally they look like this:

As you can see from the output of sp_monitor, the information it provides is similar in nature to the information provided in the Overview pane of Activity Monitor, and it can be used in the same ways.
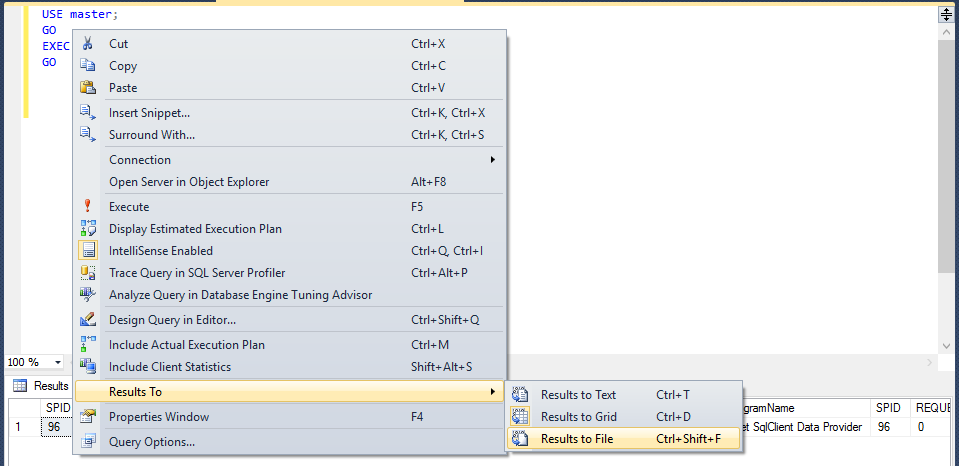
The output of sp_who2 or sp_monitor system stored procedures can be saved to a file for review at a later time. This can be helpful when working with a team or working on a performance issues over time. To save the output of any query in SQL Server Management Studio, simply right click in the query window then select Results To/Results to File.

Once that is done, each time the statement in the query window is run, Management Studio will ask for a location and file name to store the results in.
With Activity Monitor and the other tools provided by Management Studio, SQL Server provides a wealth of information and raw data related to what’s going on in any SQL Server instance. When you are not able to use Activity Monitor or want to keep a record of what’s happening in a SQL Server instance, the system stored procedures sp_who2 and sp_monitor can also provide a great deal of information.
I hope this blog series on Activity Monitor and related tools has been helpful. Please stay tuned for more SQL Server blogs in the future. If you have any questions or want to share your own SQL Server tips, please feel free to leave a comment below.
Related Posts

Why Do I Need an SSL Certificate?
Without understanding what an SSL Certificate is, it may be hard to realize why this is so important for your website. In this blog Diagram will cover both of these topics.
How Azure's Automation Transforms MS SQL Management
An exploration of the benefits of migrating to Microsoft Azure, highlighting how automated optimizations can improve MS SQL database management.
Results Matter.
We design creative digital solutions that grow your business, strengthen your brand and engage your audience. Our team blends creativity with insights, analytics and technology to deliver beauty, function, accessibility and most of all, ROI. Do you have a project you want to discuss?
Like what you read?
Subscribe to our blog "Diagram Views" for the latest trends in web design, inbound marketing and mobile strategy.
