SQL Server Locks, Blocked Processes, and Ways to Find Them
Dan Sales#Hosting

Hosting tips and tricks: learn about SQL locks and how to find the blocked processes that they can cause.
At Diagram, our hosting engineers work with our complex server configurations every day, and we often encounter issues that might seem difficult to resolve at first glance. We want to share our expertise with you and help you learn how to handle these sorts of issues. Today, we wanted to look at SQL Server Locks.
One thing that you will most certainly run into at one point or another when working with Microsoft SQL Server, or any other Relational Database Management System (RDBMS), is blocked processes caused by locks on database objects. But what are database locks, and why can they sometimes cause one process to block another?
The ACID Test
Locking is an integral part of any successful processing of transactions in any good RDBMS. The reason for this is the need for data integrity within the system. One of the important ways RDBMS keeps the integrity of the data stored is by making every transaction pass the ACID test, which means it meets the following criteria:
- Atomic - the transaction performs in an all-or-nothing fashion
- Consistent – transactions are processed in a uniform manner
- Isolated - transactions are properly isolated until they are finished
- Durable - the RDBMS will maintain a record of uncompleted transactions in the event of recovery during a failure
The isolation part of the ACID test is addressed by locking of objects (in most cases one or more rows of data) until the associated transactions are completed. The locking of objects stops all other processes from being able to change these objects until the lock is removed.
Blocking
Blocking is the logical outcome of locks being issued against various objects in a database. If a request is made against an object which has a lock issued against it, then the request is delayed until the lock is removed. The delaying or stopping of a transaction is referred as a block.
An example of this would be if request A is attempting to insert a row in table T. Subsequently, before request A completes, request B submits an update on table T. If the row affected by request A is also affected by request B, then a block is encountered, because the row affected by request A has an exclusive lock issued against it for the duration of the transaction.
There will always be some level of blocking in an active SQL Server database. This is the natural outcome of the goal of 100% data integrity and the resulting need for locks. High levels of blocking or blocks that are not quickly resolved can become a major concern. Blocking can impact a company’s ability to keep its data current, and it can also affect the end users of that data, such as clients coming to its web site. One of the most common symptoms of excessive blocking is high SQL Server wait counts, which in turn can cause slow response times to requests made on a database.
Locating Blocks
There are number of ways to locate blocking issues in SQL Server and, in turn, the system process IDs (SPIDs) involved in blocking. If you have the correct SQL Server permissions, here are two of the easiest ways to find them using SQL Server Management Studio:
SQL Server Management Studio Activity Monitor
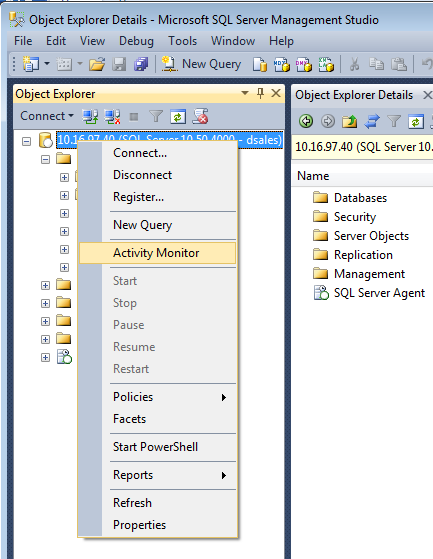
To find blocks using this method, open SQL Server Management Studio and connect to the SQL Server instance you wish to monitor. After you have connected, right click on the instance name and select 'Activity Monitor' from the menu.

Once Activity Monitor has loaded, expand the ‘Processes’ section. Any processes which are currently in a blocked state will display the SPID of the processes blocking it in the ‘Bloc By’ column. In the example below we see that SPID 55 is being blocked by SPID 54:

SQL Server System Stored Procedure “sp_who2”
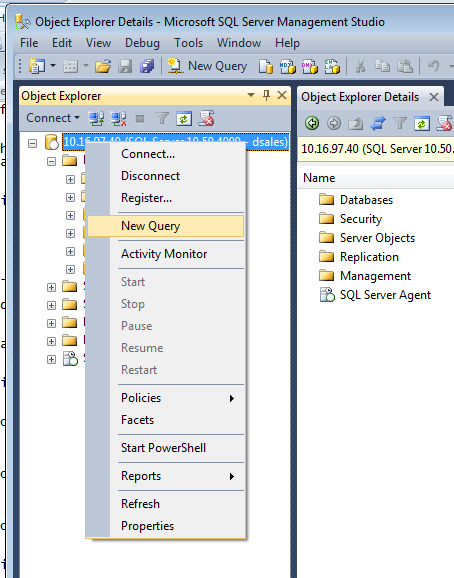
To find blocks using this method, open SQL Server Management Studio and connect to the SQL Server instance you want to run the stored procedure on. After you have connected, right click on the instance name and select ‘New Query’ from the menu.

Once the new SQL Server query window opens, type the following TSQL statements in the window and execute them:
GO
EXEC sp_who2
GO
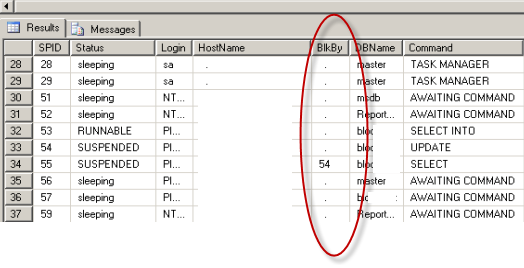
A list of processes will be displayed, and any processes which are currently in a blocked state will display the SPID of the processes blocking them in the ‘BlkBy’ column. In the example below, we see that SPID 55 is being blocked by SPID 54:

Understanding which queries and processes are causing blocks is important in helping make sure your website is running smoothly and providing the best experience for its users. Do you have any questions about how you can better manage these processes? Do you want to know more about SQL Server management? Please contact us to speak to a Solutions Engineer, or feel free to leave a comment below.
Additional resources:
Related Posts
How Azure's Automation Transforms MS SQL Management
An exploration of the benefits of migrating to Microsoft Azure, highlighting how automated optimizations can improve MS SQL database management.
Digital Budgets in the Age of AI: What to Fund First
Learn how to restructure digital budgets for the AI era: fund Answer Engine Optimization first, invest in business outcomes—not vendor hype—and manage AI costs with discipline.
Results Matter.
We design creative digital solutions that grow your business, strengthen your brand and engage your audience. Our team blends creativity with insights, analytics and technology to deliver beauty, function, accessibility and most of all, ROI. Do you have a project you want to discuss?
Like what you read?
Subscribe to our blog "Diagram Views" for the latest trends in web design, inbound marketing and mobile strategy.
