Utilizing SQL Server, Part 1: Using Activity Monitor
Dan Sales#Hosting, #Hosting Insights

We take a look at the valuable data that SQL Server Activity Monitor can provide when managing your SQL Server instance.
For people that do not work with SQL Server every day, finding out what is going on in their SQL Server instances can sometimes be a challenge. Fortunately, SQL Server has a number of built-in tools that can make this job a lot easier. This blog will be the first in a series that will explore a few of these SQL Server tools and give some insight into the data they can provide us.
There are many reasons why someone would want to get a better understanding of what their SQL Server instance is doing. The most common one we deal with here at Diagram is probably poor front-end application performance, such as a slow web site or application. When looking into something like a slow application, I always recommend looking at the both the machine serving up the application and the database server supporting it (if there is one). If that back-end database is SQL Server, then the place to start is with SQL Server Management Studio’s Activity Monitor tool.
Activity Monitor allows the user to get a graphical overview of what the SQL Server instance is doing, and it also allows the user to dig a little deeper into some of the wait statistics and recently run queries. We’ll go over the five main sections of Activity Monitor and the kind of information each section can provide the user.
Note: The current form of the SQL Server Management Studio’s Activity Monitor tool was first released with SQL Server 2008, so information presented here only applies to SQL Server 2008 Management Studio and versions following that release.
Getting Started
To open Activity Monitor, you first need be in SQL Server Management Studio and connected to the SQL Server instance you want to investigate. Within Management Studio, simply click on the Activity Monitor icon in the standard tool bar:
![]()
You can also right click on the SQL Server instance name and select Activity Monitor:
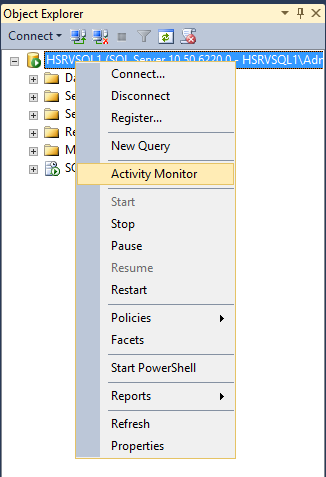
Activity Monitor will then load in the right hand panel, and you will start receiving real time data on the selected SQL Server instance.
Overview
At the top of the Activity Monitor panel will be the Overview section. This pane allows you to see how the instance is performing at a glance. Overview give you a graphical display of the following:
- Percent Processor Time - The percentage of elapsed time that the processor spends to execute non-idle threads for the instance across all CPUs.
- Waiting Tasks - The number of tasks that are waiting for processor, I/O, or memory resources.
- Database I/O - The transfer rate, in megabytes per second, of data from memory to disk, disk to memory, or disk to disk.
- Batch Requests/sec - The number of SQL Server batches that are received by the instance.

Processes
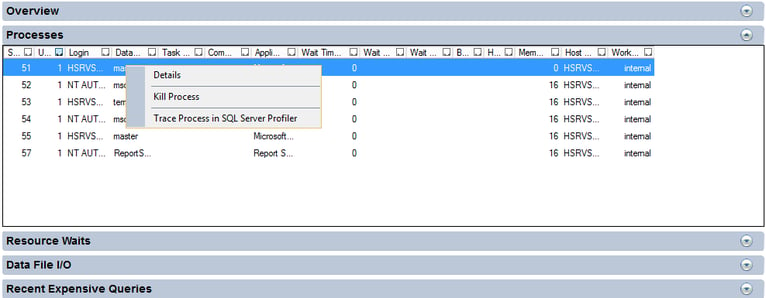
The next section down is Processes. This pane shows a list of all the active users who are connected to the SQL Server instance. It has the following columns:
- Session ID - A unique number that is assigned to each user connection when the connection is made.
- User Process - Displays 0 for a system process and 1 for a user process. By default, the filter setting for this column is 1. This displays only user processes.
- Login - The SQL Server login name under which the session is currently executing.
- Database - The name of the database that is included in the connection properties of processes that are currently running.
- Task State - The state of the task. For tasks in a runnable or sleeping state, the task state is blank. Otherwise, this can be one of the following values: Background, Running, or Suspended.
- Command - The kind of command that is being processed under the task.
- Application - The name of the application program that created the connection.
- Wait Time (ms) - The time, in milliseconds, in which this task is waiting for a resource. When the task is not waiting, the wait time is 0.
- Wait Type - The name of the last or current wait type.
- Wait Resource - The name of the resource that is needed.
- Blocked By - If there are blocking sessions, the ID of the session that is blocking the task.
- Head Blocker - If there are blocking sessions, identifies the session that causes the first blocking condition. A value of 1 represents a head blocker for other sessions.
- Memory Use (KB) - The amount of memory, in kilobytes, that is being used by the task.
- Host Name - The name of the computer that made the connection to the instance of SQL Server.
- Workload Group - The name of the Resource Governor workload group for the session.
You can right click any of the Session IDs and run a SQL Server Profiler Trace to capture all its activities or you can see the Session Details. You can even KILL a process. We will be going over these items in a future blog post.
Resource Waits
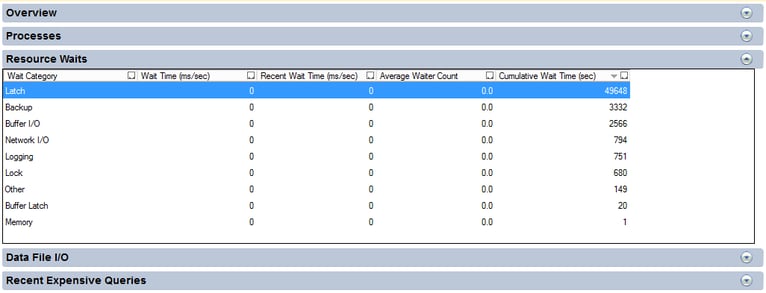
The Resource Waits pane provides valuable information with respect to SQL Server wait times and counts for key resources related to the performance of the instance. This helps identify potential bottlenecks with respect to Memory, CPU, Network I/O, etc. The columns in this pane are:
- Wait Category - The categories that accumulate wait type statistics. The individual wait types are shown in the Active User Tasks pane.
- Wait Time (ms/sec) - The wait time in milliseconds per second for all tasks that are waiting for one or more resources in the wait category since the last update interval.
- Recent Wait Time (ms/sec) - The weighted average wait time in milliseconds per second for all tasks that are waiting for one or more resources in the wait category since the last update interval.
- Average Waiter Count - The number of tasks that are waiting for one or more resources in the wait category at a typical moment during the last sample interval.
- Cumulative Wait Time (sec) - The total amount of time in seconds that tasks have waited for one or more resources in the wait category since SQL Server was last started on the instance.
Data File I/O
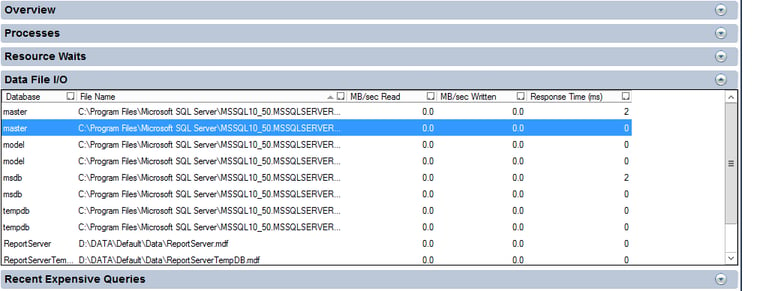
The forth pane down is Data File I/O. This provides disk level I/O (input/output) information related to all the data and log files of user and system databases. This information can be used to quickly identify databases which are performing badly due to disk bottlenecks. The columns in the Data File I/O pane are:
- Database - The name of the database.
- File Name - The name of the files that belong to the database.
- MB/sec Read - Recent read activity, in megabytes per second, for the database file.
- MB/sec Written - Recent write activity, in megabytes per second, for the database file.
- Response Time (ms) - Average response time, in milliseconds, of recent read-and-write activity to the database file.
Recent Expensive Queries
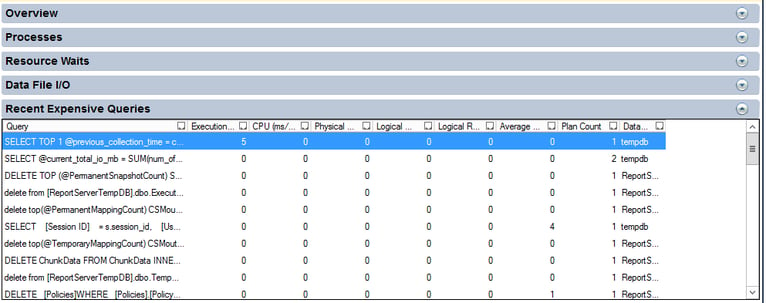
At the bottom is the Recent Expensive Queries pane. This allows you to identify poorly performing queries in an instance. You can also right click any of the queries and choose the "Edit Query Text" option to edit the query. Right clicking also lets you see the execution plan of a query by selecting the option "Show Execution Plan". The columns for this pane are:
- Query - The query statement that is being monitored.
- Executions/min – The number of executions per minute for the query.
- CPU (ms/sec) - The rate of CPU use by the query.
- Physical Reads/sec - The rate per second of physical reads by the query.
- Logical Writes/sec - The rate per second of logical writes by the query.
- Logical Reads/sec - The rate per second of logical reads by the query.
- Average Duration (ms) – The average duration in milliseconds of running this query.
- Plan Count - The number of cached query plans for this query.
By using Activity Monitor and having a good understanding of the data it is providing us, we can get a better understanding of what’s going on in real time with respect to a SQL Server instance. With this data, we can start to dig into the root causes of many database related performance issues we may be seeing in our front-end application. With this need to dig deeper in mind, in the next installment of this series, we will look at expensive queries and get a better understanding of SQL Server execution plans.
If you have any questions about using Activity Monitor, or if you have any tips of your own for how to get the most out of this tool, please feel free to share them in the comments below. If you want to know more about Diagram’s hosting services, please contact us. Thanks for reading, and we hope you join us for the next installment in this blog series!
Related Posts
How Azure's Automation Transforms MS SQL Management
An exploration of the benefits of migrating to Microsoft Azure, highlighting how automated optimizations can improve MS SQL database management.

Why Do I Need an SSL Certificate?
Without understanding what an SSL Certificate is, it may be hard to realize why this is so important for your website. In this blog Diagram will cover both of these topics.
Results Matter.
We design creative digital solutions that grow your business, strengthen your brand and engage your audience. Our team blends creativity with insights, analytics and technology to deliver beauty, function, accessibility and most of all, ROI. Do you have a project you want to discuss?
Like what you read?
Subscribe to our blog "Diagram Views" for the latest trends in web design, inbound marketing and mobile strategy.
